Deno 中的分布式追踪与上下文传播
现代应用程序通常构建为由多个相互通信的服务组成的分布式系统。在调试这些系统中的问题或优化性能时,能够追踪请求在不同服务中的流向至关重要。这就是分布式追踪的作用。
自 Deno 2.3 起,运行时现在可以自动在服务边界之间保留追踪上下文,从而使分布式系统中的端到端追踪更简单、更强大。这意味着当一个服务向另一个服务发出请求时,追踪上下文会自动传播,让您能够将整个请求流视为一个单一的追踪。
设置分布式系统 跳到标题
我们的示例系统将由两部分组成
- 提供 API 端点的服务器
- 向服务器发出请求的客户端
服务器 跳到标题
我们将设置一个简单的 HTTP 服务器,它会响应带有 JSON 消息的 GET 请求
import { trace } from "npm:@opentelemetry/api@1";

const tracer = trace.getTracer("api-server", "1.0.0");

// Create a simple API server with Deno.serve
Deno.serve({ port: 8000 }, (req) => {
  return tracer.startActiveSpan("process-api-request", async (span) => {
    // Add attributes to the span for better context
    span.setAttribute("http.route", "/");
    span.updateName("GET /");

    // Add a span event to see in traces
    span.addEvent("processing_request", {
      request_id: crypto.randomUUID(),
      timestamp: Date.now(),
    });

    // Simulate processing time
    await new Promise((resolve) => setTimeout(resolve, 50));

    console.log("Server: Processing request in trace context");

    // End the span when we're done
    span.end();

    return new Response(JSON.stringify({ message: "Hello from server!" }), {
      headers: { "Content-Type": "application/json" },
    });
  });
});
客户端 跳到标题
现在,我们来创建一个向服务器发出请求的客户端
import { SpanStatusCode, trace } from "npm:@opentelemetry/api@1";

const tracer = trace.getTracer("api-client", "1.0.0");

// Create a parent span for the client operation
await tracer.startActiveSpan("call-api", async (parentSpan) => {
  try {
    console.log("Client: Starting API call");

    // The fetch call inside this span will automatically:
    // 1. Create a child span for the fetch operation
    // 2. Inject the trace context into the outgoing request headers
    const response = await fetch("https://:8000/");
    const data = await response.json();

    console.log(`Client: Received response: ${JSON.stringify(data)}`);

    parentSpan.addEvent("received_response", {
      status: response.status,
      timestamp: Date.now(),
    });
  } catch (error) {
    console.error("Error calling API:", error);
    if (error instanceof Error) {
      parentSpan.recordException(error);
    }
    parentSpan.setStatus({
      code: SpanStatusCode.ERROR,
      message: error instanceof Error ? error.message : String(error),
    });
  } finally {
    parentSpan.end();
  }
});
使用 OpenTelemetry 进行追踪 跳到标题
客户端和服务器代码都已包含基本的 OpenTelemetry 检测
-
创建追踪器 — 两个文件都使用
trace.getTracer()并指定名称和版本来创建追踪器。 -
创建 Span — 我们使用
startActiveSpan()来创建表示操作的 Span。 -
添加上下文 — 我们向 Span 添加属性和事件以提供更多上下文。
-
结束 Span — 我们确保在操作完成时结束 Span。
自动上下文传播 跳到标题
当客户端向服务器发出请求时,神奇的事情就发生了。在客户端代码中有一个对服务器的 fetch 调用
const response = await fetch("https://:8000/");
由于此 fetch 调用发生在活动 Span 内部,Deno 会自动为 fetch 操作创建一个子 Span,并将追踪上下文注入到传出请求头中。
当服务器收到此请求时,Deno 从请求头中提取追踪上下文,并将服务器 Span 建立为客户端 Span 的子级。
运行示例 跳到标题
要运行此示例,首先启动服务器,并为您的 otel 服务命名
OTEL_DENO=true OTEL_SERVICE_NAME=server deno run --unstable-otel --allow-net server.ts
然后,在另一个终端中,运行客户端,并为客户端指定一个不同的服务名称,以便更清晰地观察传播过程
OTEL_DENO=true OTEL_SERVICE_NAME=client deno run --unstable-otel --allow-net client.ts
您应该会看到
- 客户端日志显示“Client: Starting API call”
- 服务器日志显示“Server: Processing request in trace context”
- 客户端日志显示从服务器收到的响应
查看追踪 跳到标题
要实际查看追踪,您需要一个 OpenTelemetry 收集器和一个可视化工具,例如 Grafana Tempo。
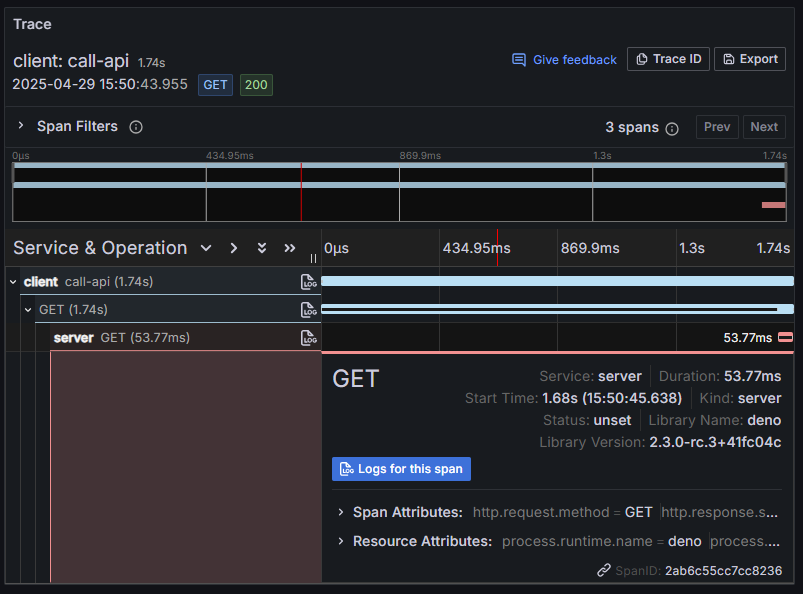
当您可视化追踪时,您会看到
- 来自客户端的父 Span
- 连接到 HTTP 请求的子 Span
- 连接到来自服务器的 Span
- 所有这些都作为单个追踪的一部分!
例如,在 Grafana 中,追踪可视化可能如下所示
🦕 现在您已经了解了 Deno 中的分布式追踪,您可以将其扩展到具有多个服务和异步操作的更复杂系统。
借助 Deno 的自动上下文传播,在您的应用程序中实现分布式追踪从未如此简单!